Data Exploration
Table of contents
Data Collection and Cleaning
Playlists
Grace created two playlists. The first includes random songs that Grace would include in her playlist (a “favorites” playlist), and the other playlist includes random songs that Grace would not include in her playlist (the “not-so-favorites” playlist). These two playlists are linked below.
Grace’s Favorites Playlist
Grace’s Not-So-Favorites Playlist
Spotify API
We then extracted our data from these playlists by using the Spotify API to create a .csv file of songs and their features.
We used the Spotify API’s user_playlist_tracks endpoint to collect track features, including track_ids, of the tracks in each of these playlists.
We then used the audio_features endpoint to get additional features like danceability for each of our tracks.
Finally, we added the in_playlist feature to each of our tracks, labeling them with a 1 if they were from the favorites playlist and a 0 indicating the not-so-favorites playlist.
All of this data was ultimately written to a spotify.csv file.
import sys
import spotipy
import spotipy.util as util
import json
import pandas as pd
from math import ceil

scope = 'user-library-read'
LIMIT = 50
PLAYLIST_1_LEN = 2660
PLAYLIST_0_LEN = 2492

def get_track_features_offset(playlist_id, offset, in_playlist):
    results = sp.user_playlist_tracks(
        'UroAv2poQoWSvUOfch8wmg',
        playlist_id=playlist_id,
        limit=LIMIT,
        offset=offset,
    )
    track_infos = []
    for i in results['items']:
        track_infos.append({
            'id': i['track']['id'],
            'name': i['track']['name'],
            'popularity': i['track']['popularity'],
            'artist': i['track']['artists'][0]['name'] if len(i['track']['artists']) > 0 else None,
        })
    track_ids = [i['id'] for i in track_infos]

    try:
        tracks_features = sp.audio_features(track_ids)
    except:
        return []
    for idx, track in enumerate(tracks_features):
        track['name'] = track_infos[idx]['name']
        track['popularity'] = track_infos[idx]['popularity']
        track['artist'] = track_infos[idx]['artist']
        track['in_playlist'] = in_playlist
    return tracks_features

def get_track_features(playlist_id, num_iters, in_playlist):
    track_features = []
    for i in range(num_iters):
        track_features.extend(
            get_track_features_offset(playlist_id, i * LIMIT, in_playlist)
        )
    return track_features


# Setup
if len(sys.argv) > 1:
    username = sys.argv[1]
else:
    print("Usage: %s username" % (sys.argv[0],))
    sys.exit()
token = util.prompt_for_user_token(username, scope)
if not token:
    print("Can't get token for", username)

sp = spotipy.Spotify(auth=token)

# Get track features
n_playlist0 = ceil(PLAYLIST_0_LEN / LIMIT)
n_playlist1 = ceil(PLAYLIST_1_LEN / LIMIT)

tracks_features0 = get_track_features('4B3qR5p6PD8nXXeq4C0Gz7', n_playlist0, 0)
tracks_features1 = get_track_features('6Jpt5r9KD8FEUDioBFV0r0', n_playlist1, 1)
tracks_features = tracks_features0 + tracks_features1

with open('spotify-more2.csv', mode='w') as f:
    df = pd.read_json(json.dumps(tracks_features))
    f.write(df.to_csv())
Data Description
Our data includes the following features:
danceability: Danceability describes how suitable a track is for dancing based on a combination of musical elements including tempo, rhythm stability, beat strength, and overall regularity. A value of 0.0 is least danceable and 1.0 is most danceable.energy: Energy represents a perceptual measure of intensity and activity. Typically, energetic tracks feel fast, loud, and noisy. For example, death metal has high energy, while a Bach prelude scores low on the scale. Perceptual features contributing to this attribute include dynamic range, perceived loudness, timbre, onset rate, and general entropy. A value of 0.0 is least energetic and 1.0 is most energetic.key: The estimated overall key of the track. Integers map to pitches using standard Pitch Class Notation. E.g. 0 = C, 1 = C♯/D♭, 2 = D, and so on. If no key was detected, the value is -1.loudness: The overall loudness of a track in decibels (dB). Loudness values are averaged across the entire track and are useful for comparing relative loudness of tracks. Loudness is the quality of a sound that is the primary psychological correlate of physical strength (amplitude). Values range between -60 and 0 db.mode: Mode represents the modality (major or minor) of a track, the type of scale from which its melodic content is derived. Mode is binary; major is represented by 1 and minor is 0.speechiness: Speechiness detects the presence of spoken words in a track. The more exclusively speech-like the recording (e.g. talk show, audio book, poetry), the closer to 1.0 the attribute value. Values above 0.66 describe tracks that are probably made entirely of spoken words. Values between 0.33 and 0.66 describe tracks that may contain both music and speech, either in sections or layered, including such cases as rap music. Values below 0.33 most likely represent music and other non-speech-like tracks.acousticness: A confidence measure from 0.0 to 1.0 of whether the track is acoustic. 1.0 represents high confidence the track is acoustic.instrumentalness: Predicts whether a track contains no vocals. “Ooh” and “aah” sounds are treated as instrumental in this context. Rap or spoken word tracks are clearly “vocal”. The closer the instrumentalness value is to 1.0, the greater likelihood the track contains no vocal content. Values above 0.5 are intended to represent instrumental tracks, but confidence is higher as the value approaches 1.0.liveness: Detects the presence of an audience in the recording. Higher liveness values represent an increased probability that the track was performed live. A value above 0.8 provides strong likelihood that the track is live.valence: A measure from 0.0 to 1.0 describing the musical positiveness conveyed by a track. Tracks with high valence sound more positive (e.g. happy, cheerful, euphoric), while tracks with low valence sound more negative (e.g. sad, depressed, angry).tempo: The overall estimated tempo of a track in beats per minute (BPM). In musical terminology, tempo is the speed or pace of a given piece and derives directly from the average beat duration.duration_ms: The duration of the track in milliseconds.time_signature: An estimated overall time signature of a track. The time signature (meter) is a notational convention to specify how many beats are in each bar (or measure).popularity: The popularity of a track is a value between 0 and 100, with 100 being the most popular. The popularity is calculated by algorithm and is based, in the most part, on the total number of plays the track has had and how recent those plays are.Generally speaking, songs that are being played a lot now will have a higher popularity than songs that were played a lot in the past.in_playlist: Response variable. Categorical variable for whether in playlist of desire. 1 if in playlist, 0 if not in playlist.
The following features were recorded to help with visualization later, but not used as predictors in our analysis, as they are not characteristics of the music itself.
name: Song titleartist: First artist of songtype: The object type, always deemed ‘audio_features.’id: The Spotify ID for the track.uri: The Spotify URI for the track.track_href: A link to the Web API endpoint providing full details of the track.analysis_url: An HTTP URL to access the full audio analysis of this track. An access token is required to access this data.
Exploratory Data Analysis
We have 5060 songs in our initial analysis. 2650 are included in Grace’s playlist, and 2500 are not included in Grace’s playlist.
Below are summary statistics for all the features we plan to analyze:
| feature | mean | var | range | min | max |
|---|---|---|---|---|---|
| acousticness | 0.540199 | 1.267884e-01 | 9.959953e-01 | 0.000005 | 0.996 |
| danceability | 0.570920 | 2.931912e-02 | 9.162000e-01 | 0.061800 | 0.978 |
| duration_ms | 245718.492885 | 1.911563e+10 | 3.346533e+06 | 44507.000000 | 3391040.000 |
| energy | 0.439224 | 6.633419e-02 | 9.901450e-01 | 0.000855 | 0.991 |
| instrumentalness | 0.143138 | 9.302492e-02 | 9.870000e-01 | 0.000000 | 0.987 |
| key | 5.223913 | 1.251578e+01 | 1.100000e+01 | 0.000000 | 11.000 |
| liveness | 0.163377 | 1.798945e-02 | 9.800000e-01 | 0.012000 | 0.992 |
| loudness | -10.270219 | 3.464989e+01 | 4.217600e+01 | -42.476000 | -0.300 |
| mode | 0.650198 | 2.274856e-01 | 1.000000e+00 | 0.000000 | 1.000 |
| popularity | 36.977470 | 4.773025e+02 | 1.000000e+02 | 0.000000 | 100.000 |
| speechiness | 0.070655 | 6.217856e-03 | 8.989000e-01 | 0.023100 | 0.922 |
| tempo | 117.657563 | 8.604272e+02 | 1.790410e+02 | 42.581000 | 221.622 |
| time_signature | 3.919763 | 1.655315e-01 | 5.000000e+00 | 0.000000 | 5.000 |
| valence | 0.425801 | 5.455384e-02 | 9.591000e-01 | 0.025900 | 0.985 |
We can see that all features have values that are expected as per the Spotify API documentation. To analyze each feature in more granularity we looked at density plots.
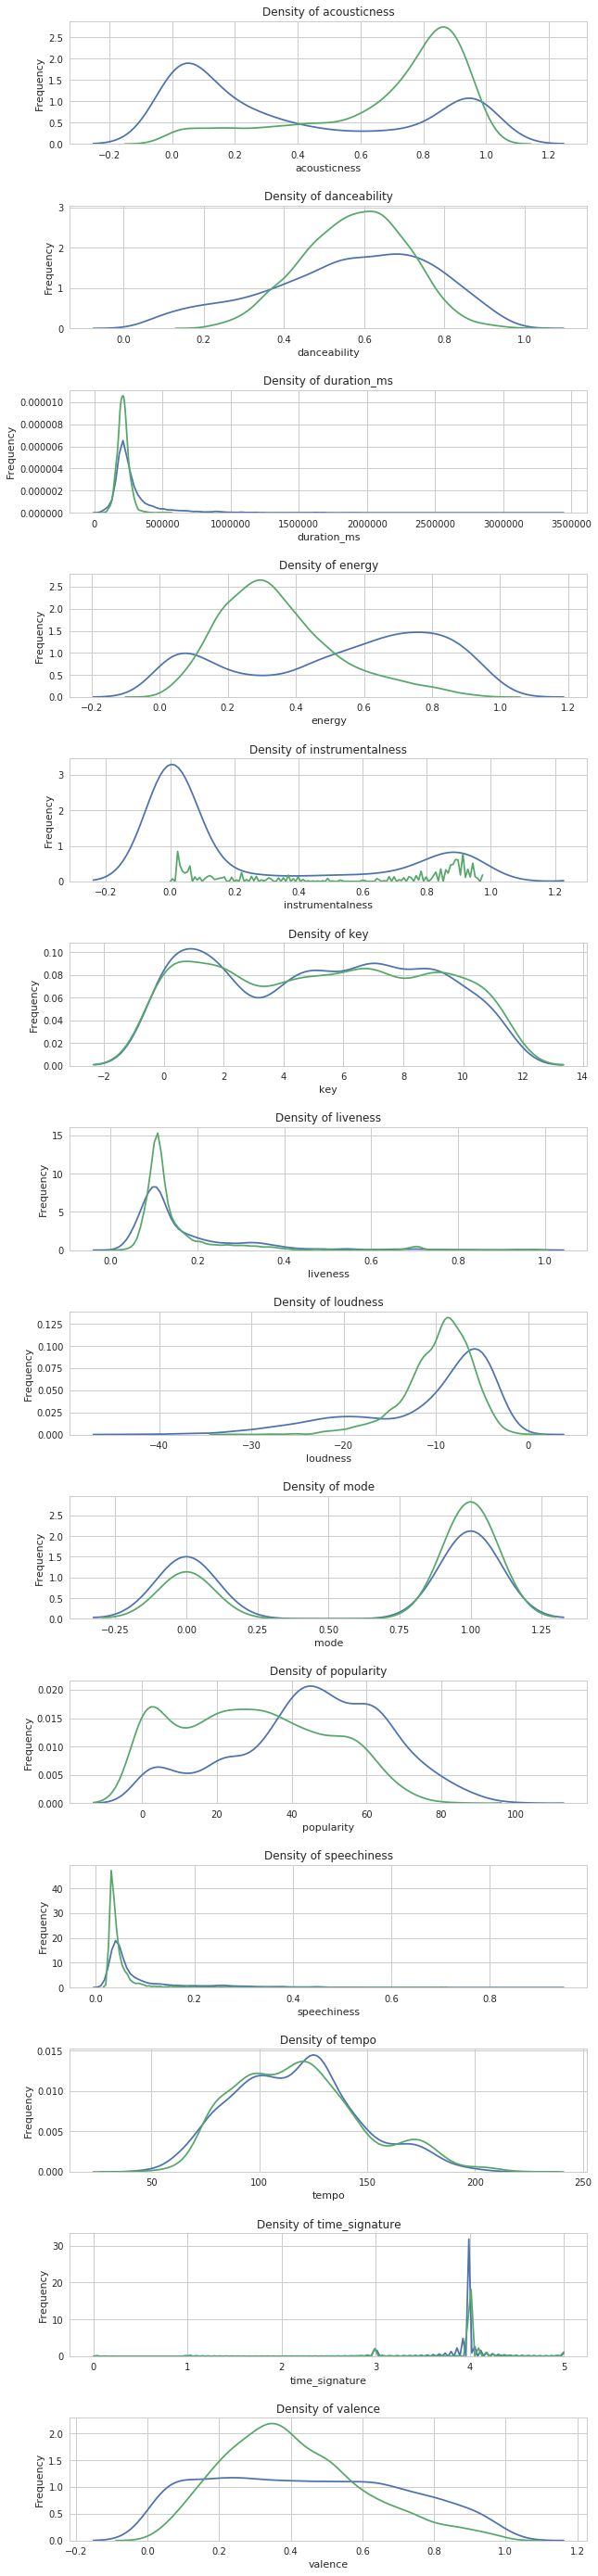
Looking at the density plots above, we note some features that show clear differences in distribution between the playlist and non-playlist. While non-playlist songs contain a roughly uniform distribution of energy values, playlist songs spike at an energy level between 0.2-0.4. Acousticness in playlist tracks is much higher on average, spiking around 0.8, while non-playlist tracks most frequently have acousticness values around 0.1. Instrumentalness is a particularly interesting feature. While the distribution non-playlist tracks is bimodal, peaking at around 0 and 0.9, playlist tracks have a few very well-defined peaks between 0 and 0.3. We will note in advance that this may induce a risk of overfitting based on instrumentalness values. Playlist tracks have lower loudnesses on average, centering around -10, while non-playlist tracks -5. In terms of speechiness, the distribution for playlist tracks has a much lower variance and slightly lower expected value, centering around 0.3 while non-playlist tracks center around 0.4. Valence for non-playlist tracks is roughly uniformly distributed, while playlist tracks demonstrate a roughly normal distribution centered around 0.3. Finally in terms of popularity, playlist tracks show a peak in their distribution around 60, while non-playlist tracks have a more variable distribution with a peak between 45-55. The rest of the features are roughly similar in distribution between playlist and non-playlist tracks.
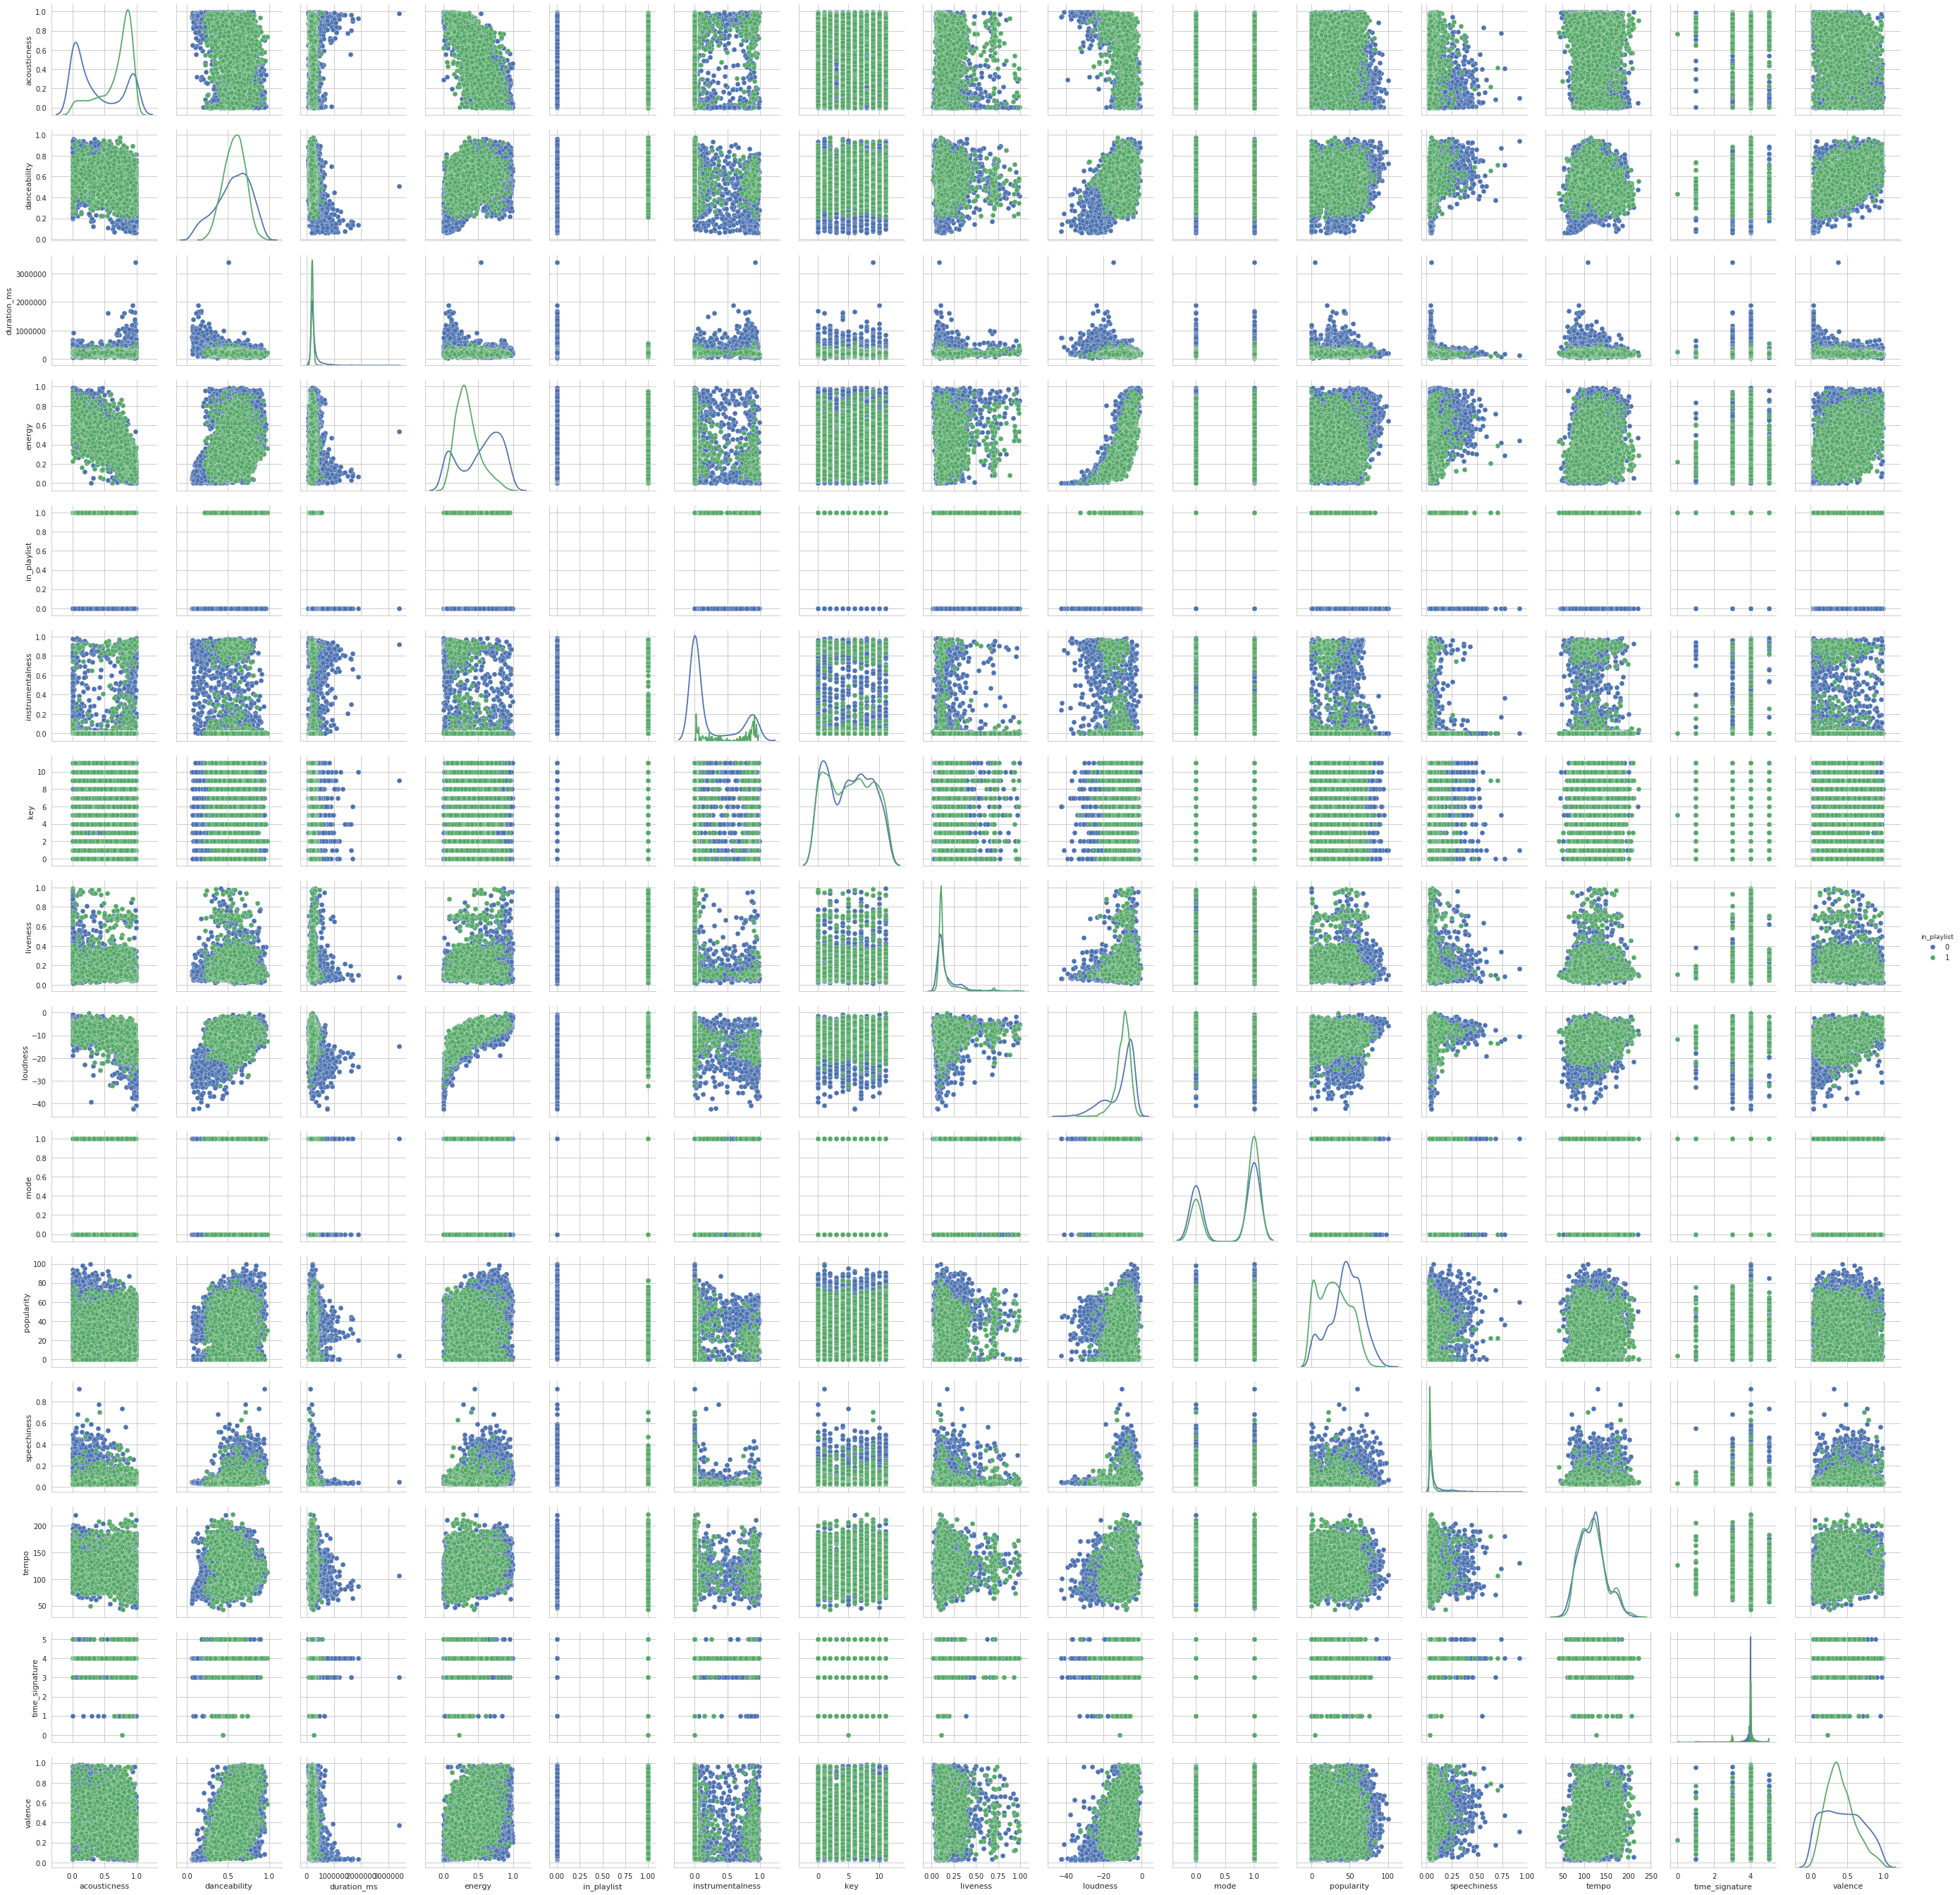
The pairplot above demonstrates a few interesting things. First, we notice weakly positive correlations between loudness and energy, loudness and danceability, and danceablility and loudness. We also notice a negative correlation between acousticness and energy. These correlations will be useful to keep in mind if we conduct variable selection or regularization at a later point. Also, none of these pairwise plots show clear separability between the two playlists.